
Plotting Regular Polygons
canvasgraphicsgeometryjavascriptarchivedRegular Polygons method
Regular polygons are shapes which are equiangular and equilateral. That is to say, all sides are the same length, and all corners are the same angle. Plotting these shapes is very simple programmatically, and we’ll create a simple function to do so.
Looking at these shapes, it’s easy to see what they have in common:
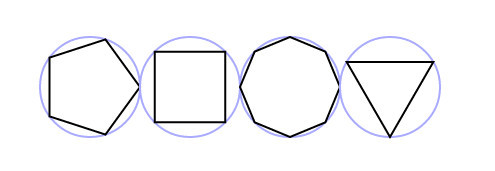
The points of the shapes can be equally plotted around the circumference of a circle.
Generating polygons
Our function will take five arguments: the x and y position that represents the centre of the shape; the radius, or distance from the centre to each of the points; the number of points for this polygon, and; the initial rotation of the shape.
function generatePolygon(x, y, r, points, rot) {Each point on the polygon can be calculated as follows (where a is the angle of the point):
x = [polygon centre x] + ( cos(a) x [polygon radius] )
y = [polygon centre y] + ( sin(a) x [polygon radius] )
Our polygon will be returned as a list of coordinates:
var coords = [];We'll also calculate the angle between each point of the polygon. In this example, we're using radians, so one full rotation is equal to 2 x π:
var seg = (Math.PI * 2) / points;We'll create a loop that steps through the number of points of this polygon, and for each point calculate its x, y position and add it to the list:
for(var i = 0; i < points; i++) {
    coords.push([
        x + ( Math.cos( ( seg * i ) + rot ) * r ),
        y + ( Math.sin( ( seg * i ) + rot ) * r )
    ]);
}
Our function will finish by just returning this list of coords:
    return coords;
}
Drawing the polygons
Using our function, we can generate our list of points for each polygon. Drawing these to a canvas is very simple: we start by moving to the first point of the list, and then loop through the remaining points, drawing a line to each of them. Once we've finished, we'll just close the path and stroke:
    var poly = generatePolygon(100, 100, 50, 5, 0);

    ctx.beginPath();
    ctx.moveTo(poly[0][0], poly[0][1]);

    for(var i = 1; i < poly.length; i++) {
        ctx.lineTo(poly[i][0], poly[i][1]);
    }

    ctx.closePath();
    ctx.stroke();
Regular Polygons source code
<!DOCTYPE html>
<html>
<head>

<script type="text/javascript">

function generatePolygon(x, y, r, points, rot) {
    var coords = [];
    var seg = (Math.PI * 2) / points;

    for(var i = 0; i < points; i++) {
        coords.push([
            x + ( Math.cos( ( seg * i ) + rot ) * r ),
            y + ( Math.sin( ( seg * i ) + rot ) * r )
        ]);
    }

    return coords;
}

function drawPolygon(x, y, r, points, rot) {
    var ctx = document.getElementById("viewshapes").getContext('2d');

    var poly = generatePolygon(x, y, r, points, rot);

    ctx.beginPath();
    ctx.moveTo(poly[0][0], poly[0][1]);

    for(var i = 1; i < poly.length; i++) {
        ctx.lineTo(poly[i][0], poly[i][1]);
    }

    ctx.closePath();
    ctx.stroke();
}

window.addEventListener("load", function () {
    drawPolygon(100, 100, 80, 5, 0);            // Pentagon
    drawPolygon(180, 150, 80, 4, Math.PI/4);    // Square
    drawPolygon(260, 120, 80, 8, Math.PI);        // Octagon
    drawPolygon(360, 150, 80, 3, Math.PI/2);    // Triangle
});

</script>
</head>
<body>

<canvas id="viewshapes" width="600" height="300">
If you see this text, please switch to a browser that supports canvas
elements.</canvas>

</body>
</html>